Your staff enter the data every day. Can your agency actually use it?
Nine warning signs your organization may be outgrowing its case management system. Ten minutes, no scoring, just an honest look at where your agency is compensating for its technology.
9
warning signs, one per area
10 min
to complete, alone or with your team
1 map
showing your three biggest burdens
Designed for established human services organizations already managing clients, programs, services and reporting requirements.
Get the free Visibility Audit
5-page PDF · instant download
You’ll get the PDF right away, plus a copy by email. No sales calls unless you ask. Privacy policy
What's inside
Nine warning signs. One honest picture.
Established agencies rarely outgrow their case management system all at once. It happens one spreadsheet, workaround, disconnected program and reporting fire drill at a time. Each check looks at one area of your agency.
01
Client information
One client. How many records?
Can authorized staff see what they need without searching across programs, files or systems?
02
Caseworker workflow
The shadow system
What are your caseworkers tracking outside your official system?
03
Service delivery visibility
“What's happening in our programs?”
Could leadership answer that today without asking staff to assemble it?
04
Cross-program connection
One agency. Multiple information islands.
What happens when the same client touches multiple programs?
05
Data completeness
The missing-data surprise
When do you discover required information wasn’t captured?
06
Reporting
The reporting fire drill
How much work happens between “the data is entered” and “the report is ready”?
07
Outcomes
Activity isn't the same as impact
Can you connect what your agency did to what changed for the people you served?
08
Leadership visibility
“Can someone get me that number?”
What happens when an executive, board member or funder asks an unexpected question?
09
System adaptability
Your agency changed. Did your system?
Think about the last new program, funding requirement or form change. What happened?
Notice the pattern?
Most of these warning signs trace back to one thing: how your forms and fields were built. Information that isn’t captured as structured data at the start can’t be counted at the end, no matter how good your reporting tool is.
Not what your system can theoretically do. Tick the statements that ring true in each of the nine areas.
2
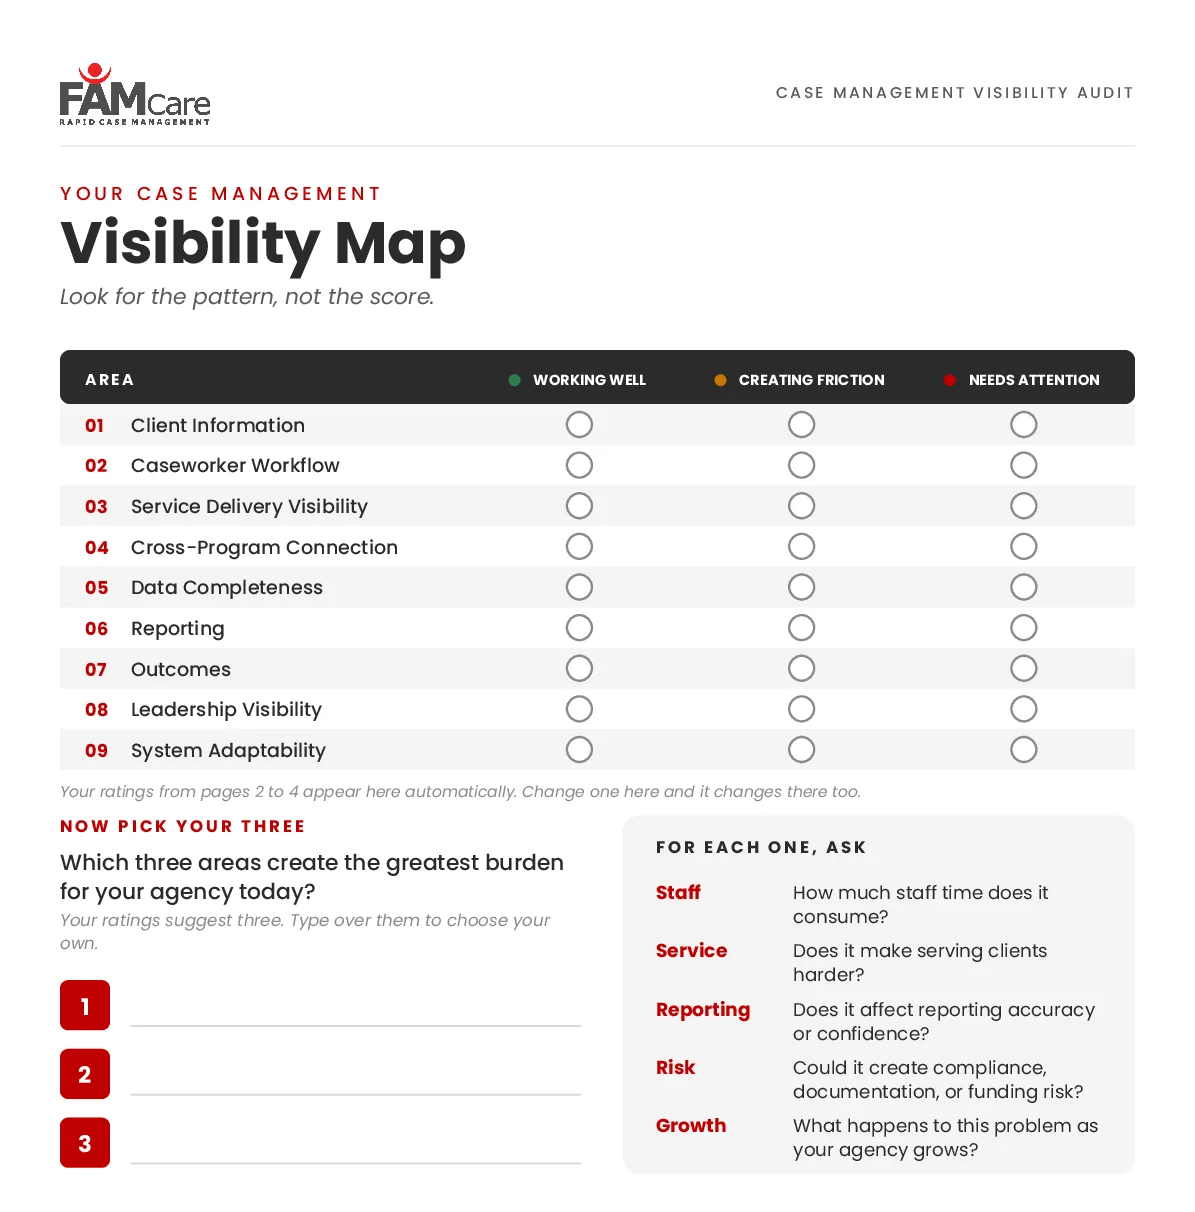
Rate each area
Working WellCreating FrictionNeeds Attention
3
Pick your three on the Visibility Map
Choose the three areas that create the greatest burden, then ask what each costs in staff time, service, reporting, risk and growth.
Watch: using the Audit with your team
After the Audit
The Audit finds the friction. The Data Health Check finds what's driving it.
The Data Health Check is a conversation with our team. We go deeper across six areas of agency performance, including whether your forms collect what your funders actually ask for, and give you a scored assessment with an Executive Summary for your leadership.
A call with our team. Scored assessment and Executive Summary.
Step 3
Reporting Confidence Review
A virtual hour for your leadership team. Lunch is on us.
Our staff are able to save time in not having to create extra reports. They can just click a button or a few to say, ‘Produce the report.’ That is what success looks like.
Maria Guerra, Family and Social Services Director, Kenaitze Indian Tribe
Trusted by agencies that can't afford uncertain data
Anyone who sees across programs: an executive director, program director, or data or quality lead. It’s even more revealing when a few leaders complete it separately and compare answers.
No. You rate each area Working Well, Creating Friction or Needs Attention, then look for the pattern: where your agency is compensating for its technology.
The Audit shows where friction exists. The Data Health Check, completed with our team on a call, shows what’s driving it and ends with a scored Executive Summary.